
Ah yes, the financial slides in a pitch deck — the most important slide to most investors.
For investors, financials are a primary indicator of whether or not a startup is worth the investment.
On the other hand, founders have mixed feelings about financials. Many may already have a firm grasp of basic accounting or finance, however, founders who are creating early-stage pitch decks may find this particular slide difficult. Moreover, more mature startups with customers and sales might not know what metrics are best to show, or how to show them.
So many questions remain: should Pre-seed rounds show financials? How far in the future should a startup in the Seed round project? What should a more mature, Series-A round show in terms of financials?
What we know for sure is how crucial these slides are for investors. DocSend’s 2015 study reveals that out of all the possible slides in a pitch deck, investors spend the most time reading the financial slides.
Apart from this, there isn’t any data-based research on the ‘right’ way of showing financial slides. All that’s available are tons of online opinions which vary greatly depending on who you ask.
So, we put our research hats on and analyzed 25 opinions from credible online resources.
This article outlines our research.
This quick study started with searching for credible online resources which included blogs, books, and articles. After we filtered out keyword-heavy and utterly useless SEO articles, we analyzed each piece of content.
In the end, we narrowed our resources to 25 expert opinions from consultants and investors. The study revealed a total of 192 recommendations which were filtered into three categories:
Next, we classified each into several sub-categories.
Now, onto the findings.
These slides must succinctly outline the financial health of a company while projecting revenue potential in the future. Our research revealed the key metrics that investors are expecting to see and how they’re expecting to see them.
However, there is no one-size-fits-all method to perfectly create these slides.
Why?
Financial data always depends on the startup’s maturity. For example, a startup raising Angel funding with no customers won’t have the data needed to make financial projections. On the contrary, startups that are raising higher rounds have years of financial data to present to investors.
The bottom line:
Let’s break this down. We found seven types of financial data that were mentioned often:

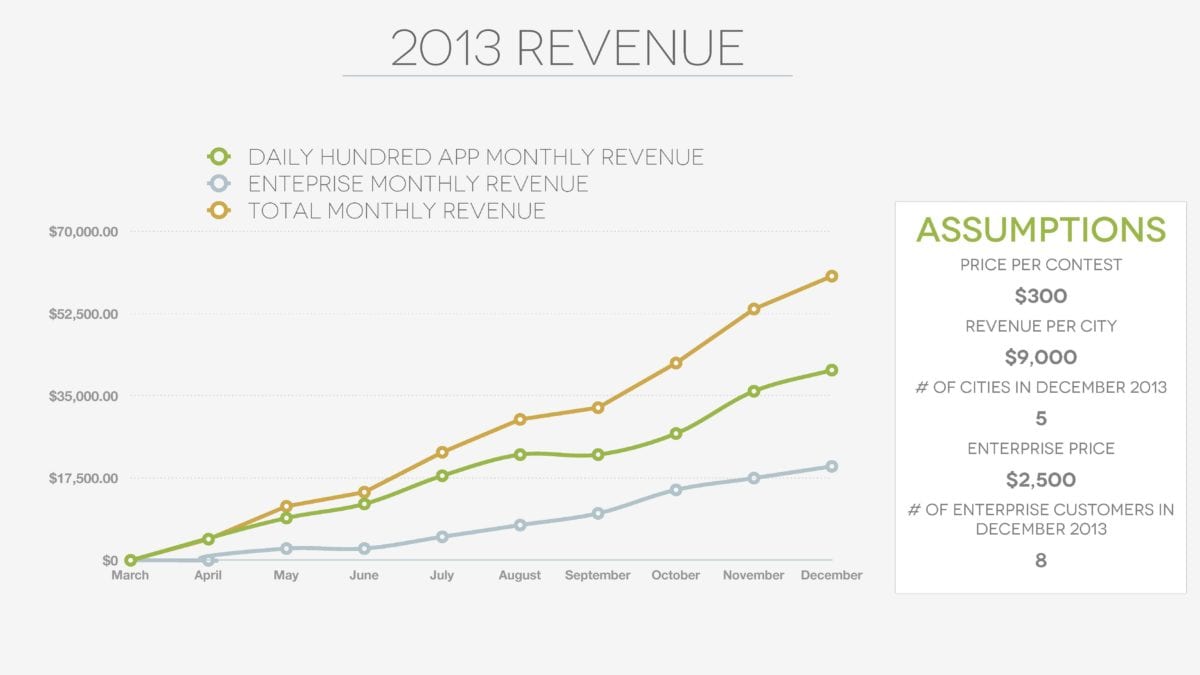
Any type of cash that flows into the business through various channels is classified as income. This shows investors the amount of money earned through operations.
Income (and income potential) is the financial metric that investors are most interested in. It received 35.8% of mentions from investors and consultants making it the most recommended financial data to show.
Why? Investors want companies they invest in to earn massive revenues. For startups, higher revenues lead to higher valuations, and eventually, higher investor returns.
Here’s a few questions we hear investors ask:
Here are some examples of metrics under Income:
Financial experts at Knit People discussed in an article that:
“The best thing you can do to convince investors is to demonstrate traction. In other words, do you have paying customers? If you have traction, use it to create a foundation for your growth goals and projections.”
According to startup consultant and investor, Alejandro Cremades:
“If you don’t have sales yet, you can still offer hypothetical projections of performance based on competitors, market research, and niche growth.”


“It takes money to make money.” We’ve all heard the axiom, and this is where it comes to life. Profit comes with a cost and investors want to know the scale of a startup’s operational expenses to better evaluate the investment.
How much is the manufacturing cost of the product (cost of goods sold)? What are the labor expenses of the startup? What about general overhead and administration costs? Advertising, marketing, and sales budgets? What about anything that is industry-specific like licenses or certifications?
These are just a few questions that need to be answered by this type of financial data.
Expenses ranked second most popular among investors and consultants with 24.1% of mentions.
A few examples under this type of financial data are:
Financial Consultant, Mike Lingle, says:
‘How do I make money and how much does it cost me? These are the two main questions in every investors mind, and this slide tells them exactly what to expect.’
Commonly, income and expenses go together on the same slide to show investors a general overview of the company’s financial health and profitability (more on that later).

Beyond money in and money out, each business model has its own specific KPIs (Key Performance Indicators) that determine its success.
For instance, at a high level, Uber’s business KPIs might be number of drivers, number of riders, and average fare per ride. These metrics give insight into how the business will generate income and scale.
This type of financial data ranked third most popular among investors and consultants in our study with 20.4% of mentions.
A few examples are:
Consultants at Designli advise startups that:
“To back up your projections, share your customer counts (including presales), conversion metrics, and average sale to date. Your mission in this slide is to show investors the financial direction of your business.”
These KPIs can be shown on the same slide as income and expenses or given their own slide.


(Money in) - (Money out) = Profit
However, it often takes years for a company to become profitable, and investors know this. While investors are not looking for immediate profitability, they do look at revenue potential which ultimately drives the future valuation of a company as we mentioned previously.
A company that makes $100 Mil in revenue and has a 10x valuation when it goes public will be worth $1B in equity. An investor can potentially exit, sell shares, and make serious returns on their investment. We read recently that up to 95% of the total investor gains in a startup come from pre-IPO investments.
Showing profitability ranked fourth most popular among investors with 10.5% of mentions.
Metrics include:
According to Investopedia:
‘Investors and analysts can use gross profits to determine how well a company generates profit from their direct labor and direct materials, whereas they can use EBITDA to analyze and compare profitability among companies and industries.’
However, profitability is low on the list with only 10.5% of mentions from our resources. Financial Experts at Spice Route Finance says:
'Guess what? It’s 2020 and revenue is still investors’ bigger concern. Especially, in light of the spectacular startup busts we’ve witnessed in 2019 and 2020.’

Market Size is usually a stand-alone slide that is necessary in all pitch decks. We at STORY don’t really look at this as part of the financial slide section as we often include it in the ‘opportunity’ section earlier in the deck. But since it earned 5.6% of mentions from our resources, we’ll discuss it nonetheless.
Market Sizing refers to the amount of demand that exists for the startup’s product or services. It is also sometimes referred to as TAM, SAM, SOM.
Consultants at The Business Plan Shop defined this concept best:
For startups struggling to determine a market size, we often ask ‘whose lunch will you eat?’
For instance, when the first car came out, it took revenue from horses and buggies and eventually made them obsolete. A century later when Uber launched, they stole revenue from taxis.
If you have ‘current alternatives’ in your pitch deck, this should match your market size slide.
How big do these numbers need to be? The short version is ‘as big as realistically possible.’
A startup operating in a $100B market has better chances of hitting $1B in revenue compared to a startup operating in a $2B market. So, investors place an emphasis on revenue potential as it pertains to market size for this reason.


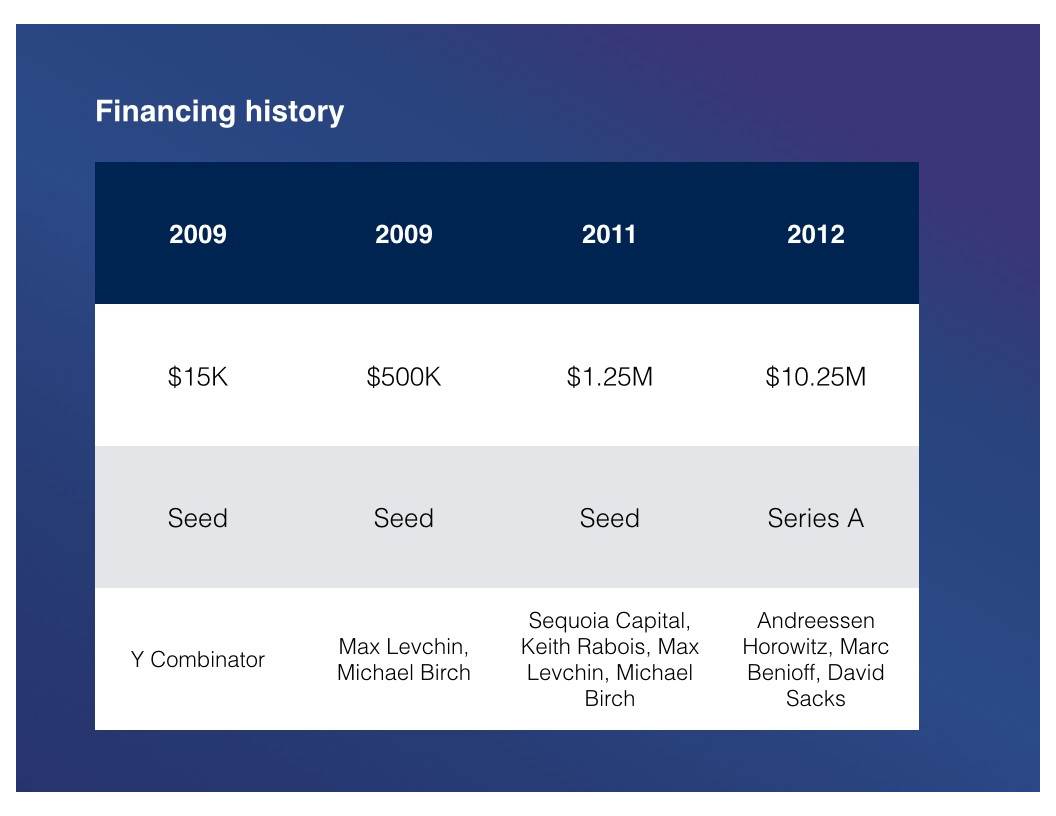
Social proof in any form can help boost chances of a startup getting funded. In the case of later-stage startups (Series-A and above), this can be done by showing past funding. While it ranks sixth with only 3.1% of mentions, it’s still a metric that’s worth considering.
A more detailed version of the past funding slide is the cap table. According to Investopedia, a cap table or capitalization table, is a spreadsheet showing equity capitalization for a company. it is often used by startups to show an intricate breakdown of its shareholder equity. The cap table includes common equity shares, preferred equity shares, warrants, convertible equity, and more.
It gives helps investors understand current level of ownership and provides social proof that other investors believe in the growth potential of a particular startup.
Consultants at Designli reiterates:
“Share any prior funding, which will help demonstrate that others have seen promise in your company.”
Our study uncovered an interesting finding about financial slides: ROI ranks dead last among financial metrics that investors expect to see. Our theory is that investors believe financial projections are often inaccurate — including ROI.
According to Dave Parker, a five-time founder, entrepreneur and professional board member for tech growth companies,
'Investors know that this [financial projections] is going to be wrong. The question is just how wrong.'

Apart from the key metrics that should be included in the financial slides, many of the resources we found placed a massive emphasis on how the data should be presented. Thus, we found it fitting to place this in its own category.
Under this category are three primary recommendations, ranked by popularity:
Let’s dissect each.
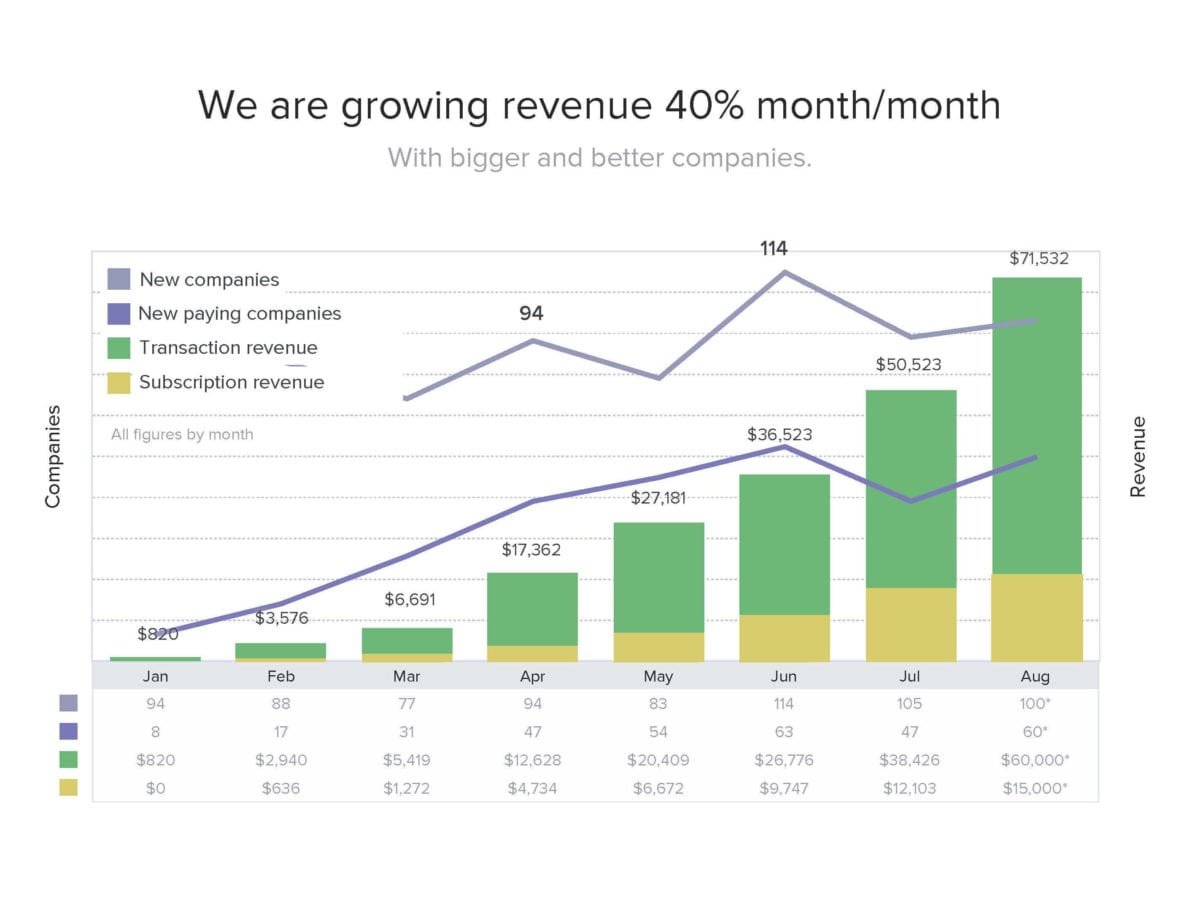
Many founders make the mistake of simply throwing in a massively dense spreadsheet of data onto a slide. While this provides a strong level of detail, it’s not an efficient way to present this information.
Investors and consultants in our study recommended to make the financial slides as visual as possible. They advised saving the full balance sheet for the appendix and using simplified charts and graphs to visualize the data.
This recommendation received nearly half of the mentions from our resources under the Visual category.

Since the financial slides are so crucial to investors, founders sometimes can go overboard when it comes to inflating their data. Our resources revealed that this is one of the biggest mistakes a founder can make in creating their financial slides.
Though we’ve mentioned that investors know that financial forecasts are often inaccurate, it’s still important to present ‘realistic’ data.
Why?
Suppose a startup successfully wins over an investor with over-exaggerated numbers. The due diligence process will reveal this and investors will likely pull out. Talk about embarrassing.
But what does realistic actually mean? The answer is, disappointingly, ‘it depends.’
Think about it this way: a startup that receives an investment of $100,000 likely won’t be able to generate $100,000,00 in revenue from it. Business just doesn’t work like that.
To put it simply, magic isn’t real. Revenue doesn’t magically grow without an increase in sales staff or marketing budgets.
Realistic and accurate financials were the second most popular recommendation with a third of the mentions under the visual category.
Lastly, investors and consultants recommended that startups show financial projections in an easy-to-understand timeline. While this ranked last, it’s most definitely not least.
But, how long should pitch deck financial projections be?

In this last section, we’ll talk about financial projections. The most common question we get is, ‘How far in the future should a business forecast?’
Our research revealed that three years is the most popular recommendation. The second most recommended is three to five years. This hints that there is some wiggle room to interpret this. Either way, we say three years is a great place to start.
Wrapping up, our research on financial slides showed what goes into the slides, how show the data, and how far into the future forecasts should be.
Here’s a rundown of what we’ve learned:
Financial slides show investors how the startup might fare in the future. While the content varies depending on the startup’s maturity, it’s important to emphasize accuracy. Remember, magic isn’t real. Fundraising should always be grounded in building trust between the startup and the investors and this starts with financial honesty and realism.
Want more data-based research on pitch decks? Check out our research library.
Learn how to write the FIVE most crucial fundraising sentences for your startup.
Buy Now - $47We ensure your deck has everything in it that investors look for so your startup can land more meetings more often.
We’ve written hundreds of decks since 2018; we know what works, what doesn’t, and how to embody the tone you’re going for.
For most startups, your brand begins with your pitch deck. We work with existing brands, and even create brand-new ones.
Sign up and get the knowledge you need to succeed.


